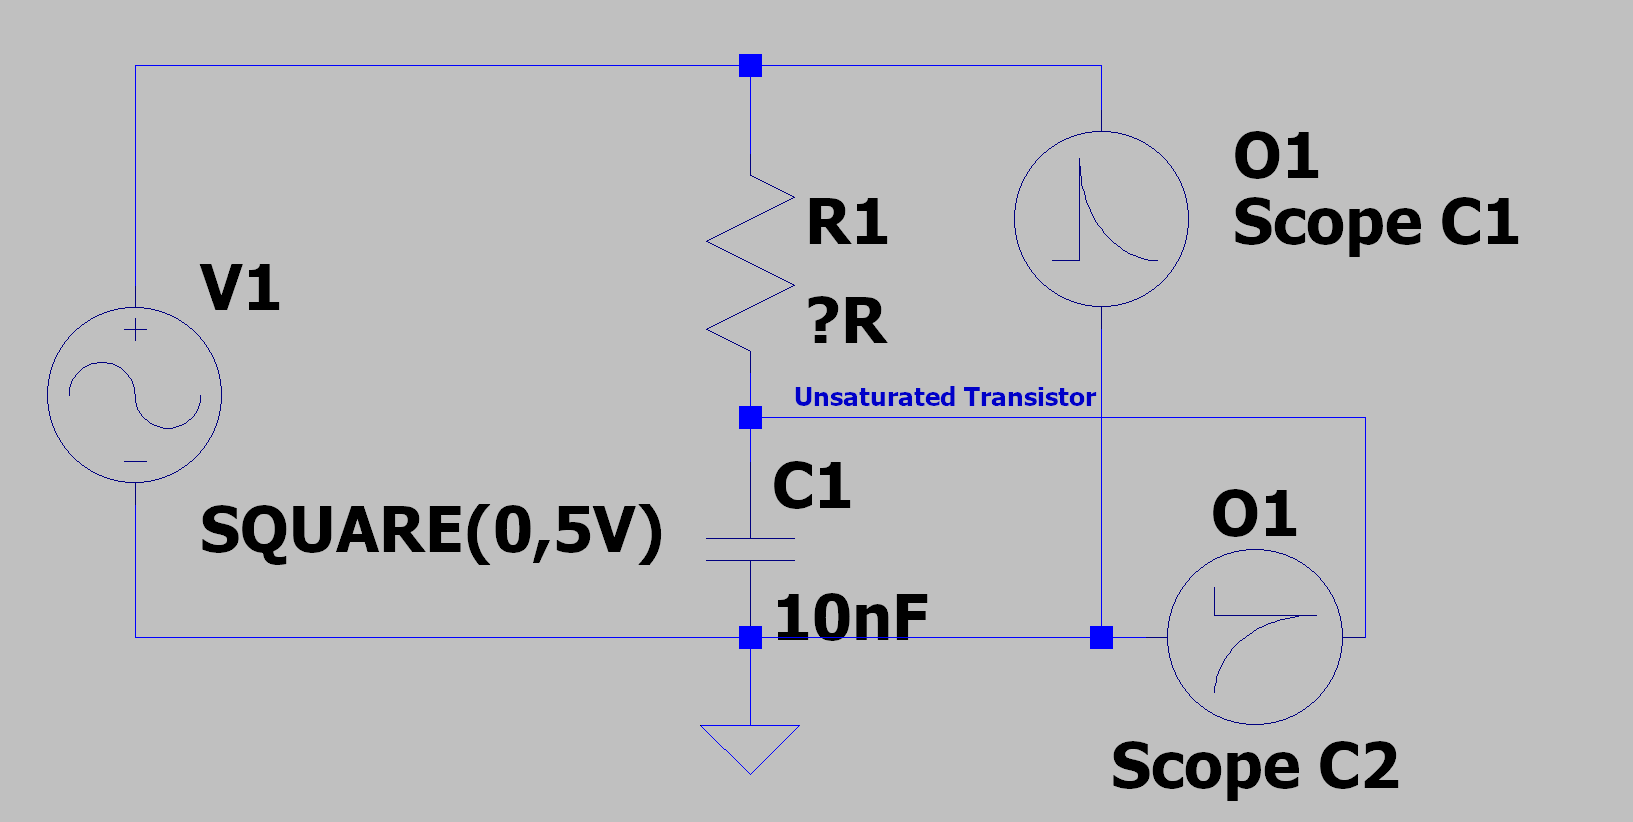
Suppose you have this simple RC circuit above just lying around. By setting the frequency of the signal generator to be low, we can let the circuit reach its steady-state response time. The charge and discharge of the ceramic capacitor is the key for us to experimentially determine the value of the resistor, R. The model we can use is
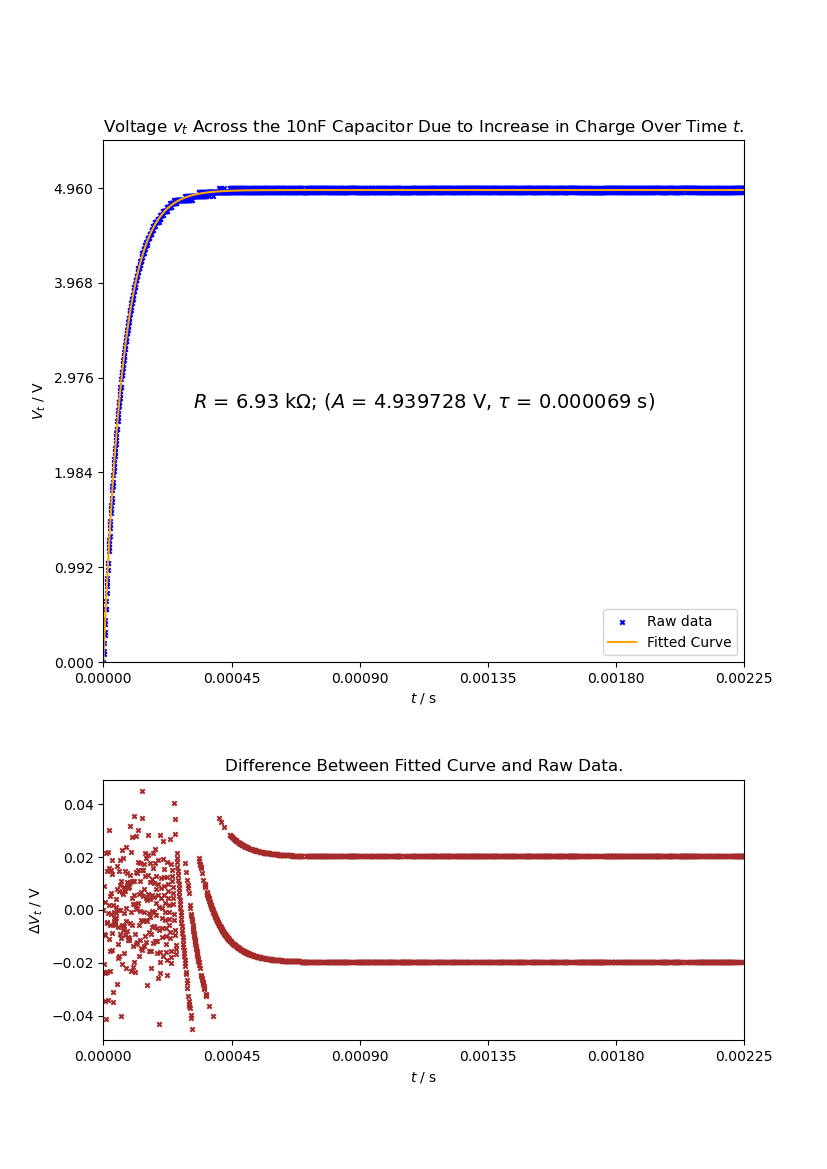
where A is the rising edge amplitude at the start of the capacitor's charge at t = 0 seconds. The voltage data across the circuit from the oscilloscope was outputted as a CSV file. The Python code linked here took this data, fitted the model, found A, time constant τ, and also the value of R. The program also produced two nice graphs (see below), including ΔV, the uncertainty in V(t), as a bonus. Cheers!

My Python Foray: Using Matplotlib, Scipy and Numpy. by unsaturatedtransistor is licensed under CC BY-SA 4.0.
